Monthly · Sources cited

Grid-Scale Battery Storage Monthly Report, October 2026

The price of electricity changes with the time of day. "Grid-scale battery storage" (large batteries connected to the transmission network that store electricity and release it) earns money from that difference. This monthly report uses published figures and our own records to show this month's trends in charts.

Science X Inc. · Published November 1, 2026 · A4, 7 pages

Three things that moved this month

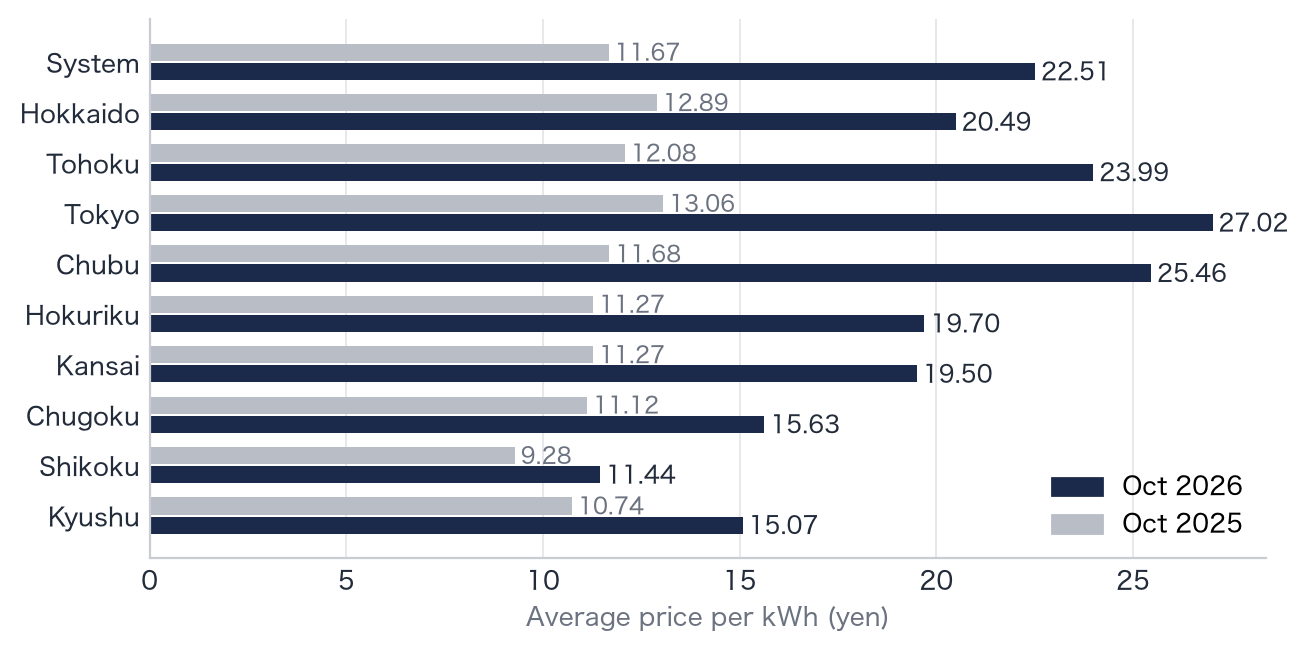
Wholesale electricity is electricity that power companies and retailers buy and sell. Its price is set on the "spot market" of the Japan Electric Power Exchange (JEPX), a market where electricity for the next day is bought and sold the day before.

Figure 1  Average wholesale electricity price (yen/kWh). Navy is October 2026, grey is the same month last year
Figure 1 Average wholesale electricity price (yen/kWh). Navy is October 2026, grey is the same month last year

Source: Spot market trading results published by the Japan Electric Power Exchange (JEPX). Simple average of 30-minute prices. Compiled by us.
How the electricity price moves during the day

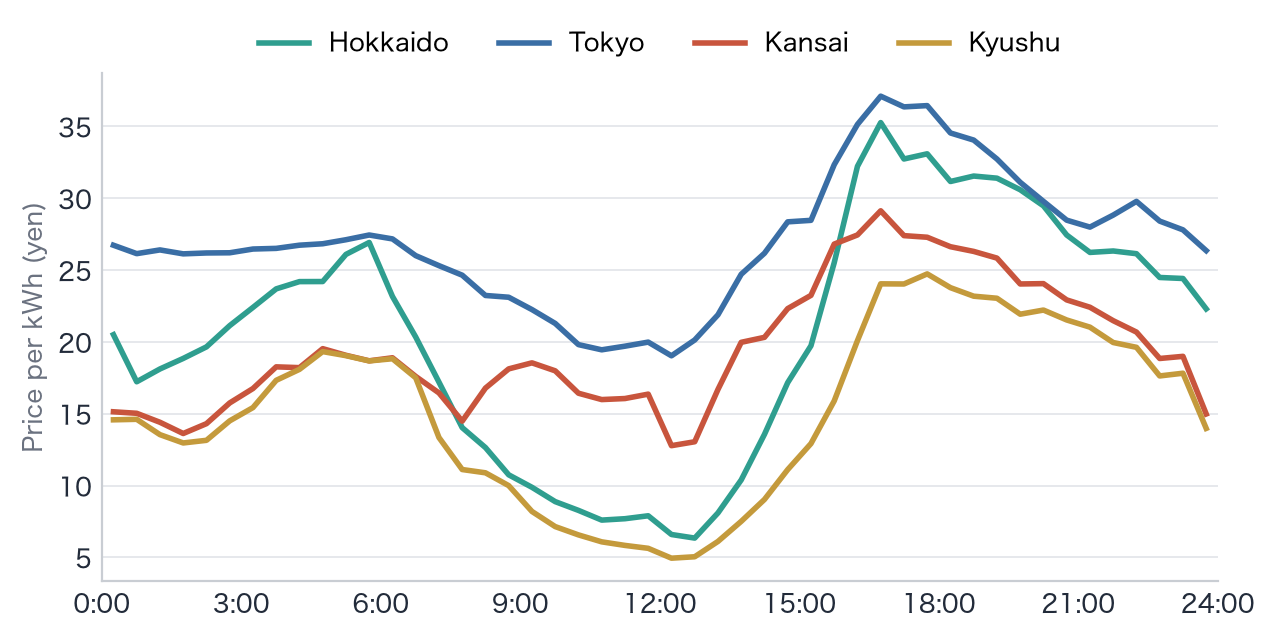
The electricity price changes every 30 minutes. The chart shows the shape of a day, averaging the price at the same time across the month. If a battery stores electricity when it is cheap and releases it when it is expensive, the difference becomes its revenue.

By time of day, the average ranged from 19.03 yen around 12:00 to 37.11 yen around 16:30 in Tokyo, and from 4.94 yen around 12:00 to 24.74 yen around 17:30 in Kyushu.

Figure 2  Peaks and troughs of the price during the day (average for October 2026, yen/kWh)
Figure 2 Peaks and troughs of the price during the day (average for October 2026, yen/kWh)

Source: JEPX spot market. Compiled by us.

There is a price gap every day

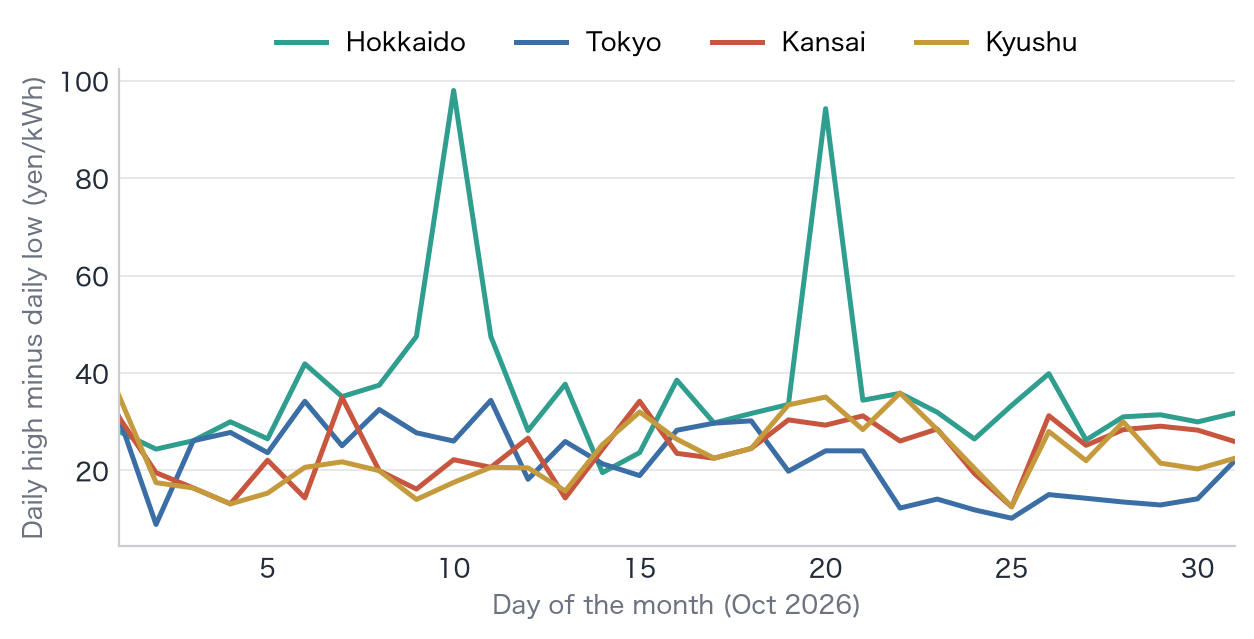
We lined up, day by day, the difference between the highest and lowest price within each day. The bigger the gap on a given day, the more room a battery has to earn from the price spread.

The monthly average of the daily gap between the highest and lowest price was 36.50 yen in Hokkaido, 24.05 yen in Kansai, 23.15 yen in Kyushu and 21.87 yen in Tokyo. The price was 0.01 yen in 91 30-minute slots in Kyushu and in 16 in Tokyo.

Figure 3  Daily price gap (the day's highest price − lowest price, yen/kWh)
Figure 3 Daily price gap (the day's highest price − lowest price, yen/kWh)

Source: JEPX spot market. Compiled by us.

Three revenue streams for a battery site

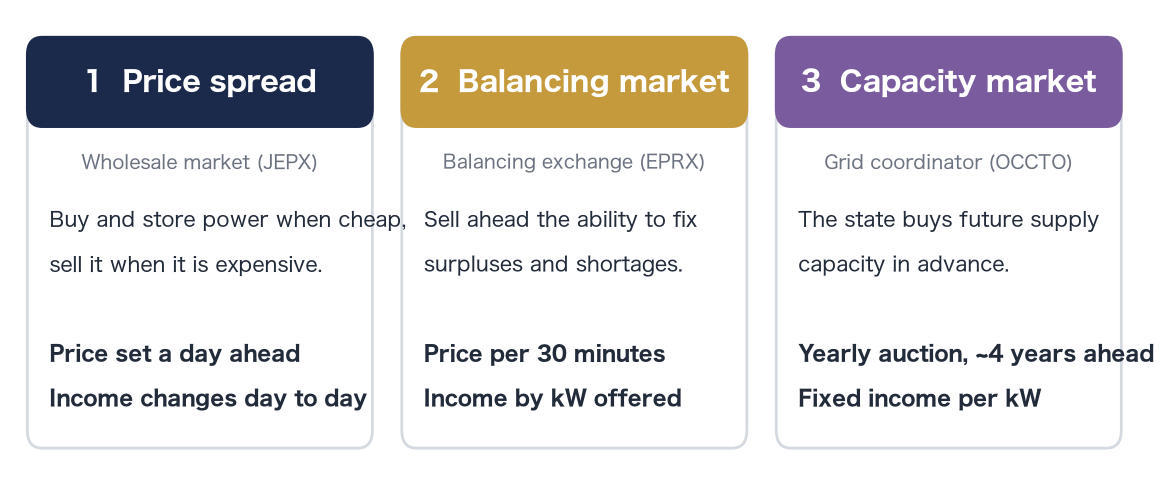
A battery site earns money in three main ways: the electricity price spread (wholesale electricity market), the balancing market (a market that buys and sells the "capacity" to fix surpluses and shortages of electricity), and the capacity market (a market that buys future electricity supply capacity in advance). In the capacity market, power plants and battery sites receive a fixed income per kW.

Figure 4  Three revenue streams for a battery site
Figure 4 Three revenue streams for a battery site

Source: Rules of the Japan Electric Power Exchange (JEPX), the Electric Power Reserve Exchange (EPRX) and the Organization for Cross-regional Coordination of Transmission Operators (OCCTO).

How much does a battery earn? (estimate)

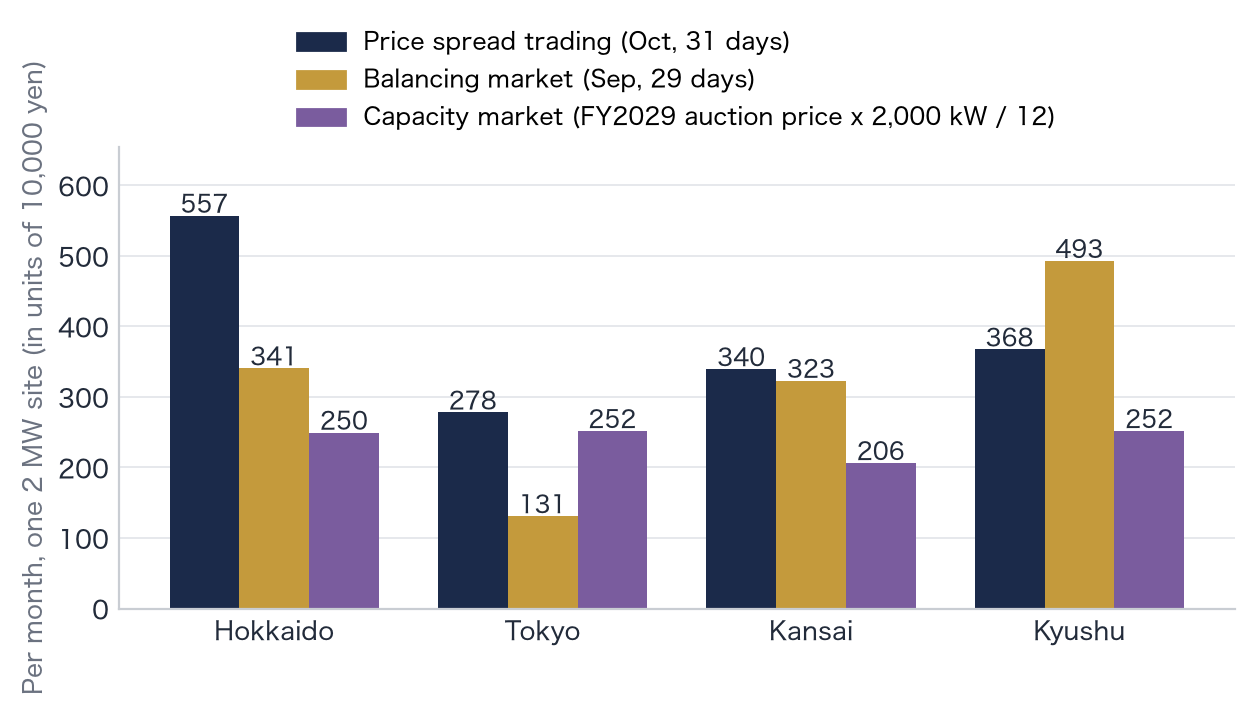
These are monthly figures for one battery site with 2MW output and 8MWh capacity. For electricity trading, we assume it charges during the 4 cheapest hours of each day and discharges during the 4 most expensive hours. For the balancing market, we assume it offers 2MW to Tertiary reserve 2 all the time. For the capacity market, the amount is the clearing price multiplied by 2,000kW and divided by 12. All are rough estimates. They do not show or guarantee actual revenue (assumptions in section 11). The gold bar for the balancing market is for September (September 1–29), a different month from the navy bar for October.

In our estimate for one battery site, Tokyo earns ¥2.78 million from the price spread (October), ¥1.31 million from Tertiary reserve 2 (September) and ¥2.52 million from the capacity market (per month). Kyushu earns ¥3.68 million, ¥4.93 million and ¥2.52 million on the same basis.

Figure 5  Estimated revenue for one 2MW / 8MWh battery site (estimate, in units of ¥10,000 per month)
Figure 5 Estimated revenue for one 2MW / 8MWh battery site (estimate, in units of ¥10,000 per month)

Source: Our estimate based on the JEPX spot market, EPRX preliminary figures and clearing prices published by OCCTO. Assumptions in section 11.

Batteries are also used in the balancing market

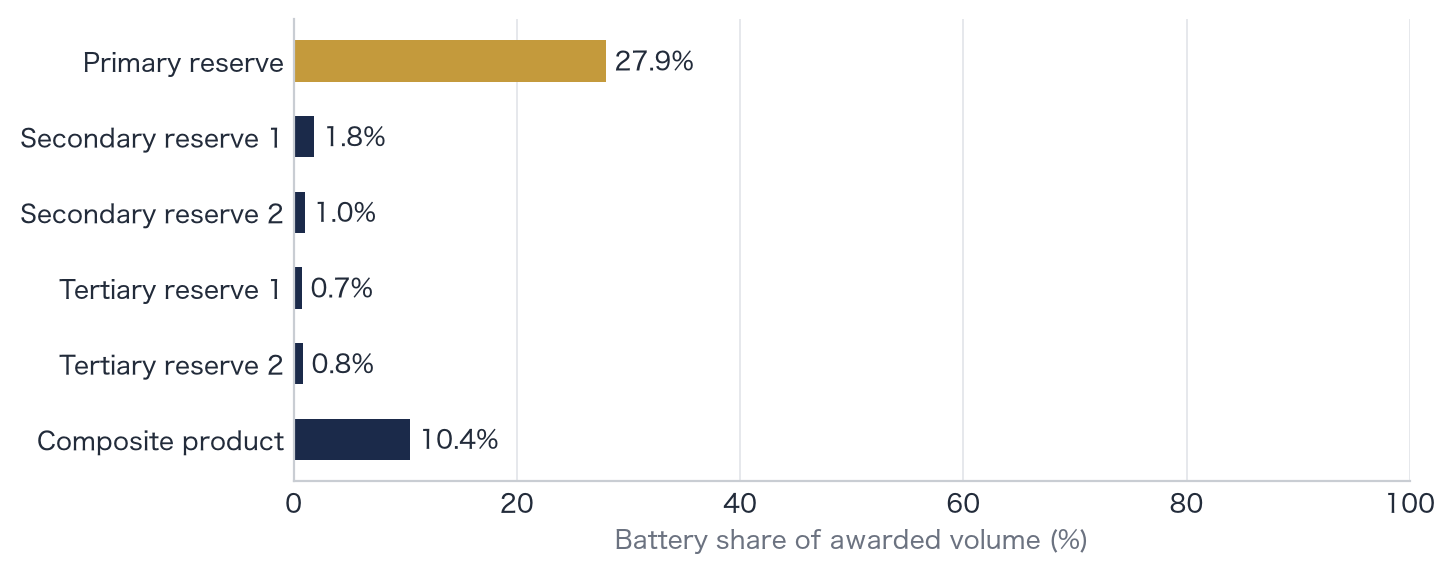
In the balancing market, the smaller the product number, the faster the response required. The chart shows the share of batteries in the volume awarded. The published figures for October 2026 are not yet in our tally, so we show September 2026 (preliminary), the most recent month with all products available.

In September 2026 (preliminary), batteries made up 27.9% of the volume awarded in Primary reserve, 10.4% in Composite product, 1.8% in Secondary reserve 1 and 0.8% in Tertiary reserve 2.

Figure 6  Share of batteries in the balancing market (%)
Figure 6 Share of batteries in the balancing market (%)

Source: Trading results (preliminary) published by the Electric Power Reserve Exchange (EPRX), by power source type. Compiled by us.

The capacity market buys future supply capacity

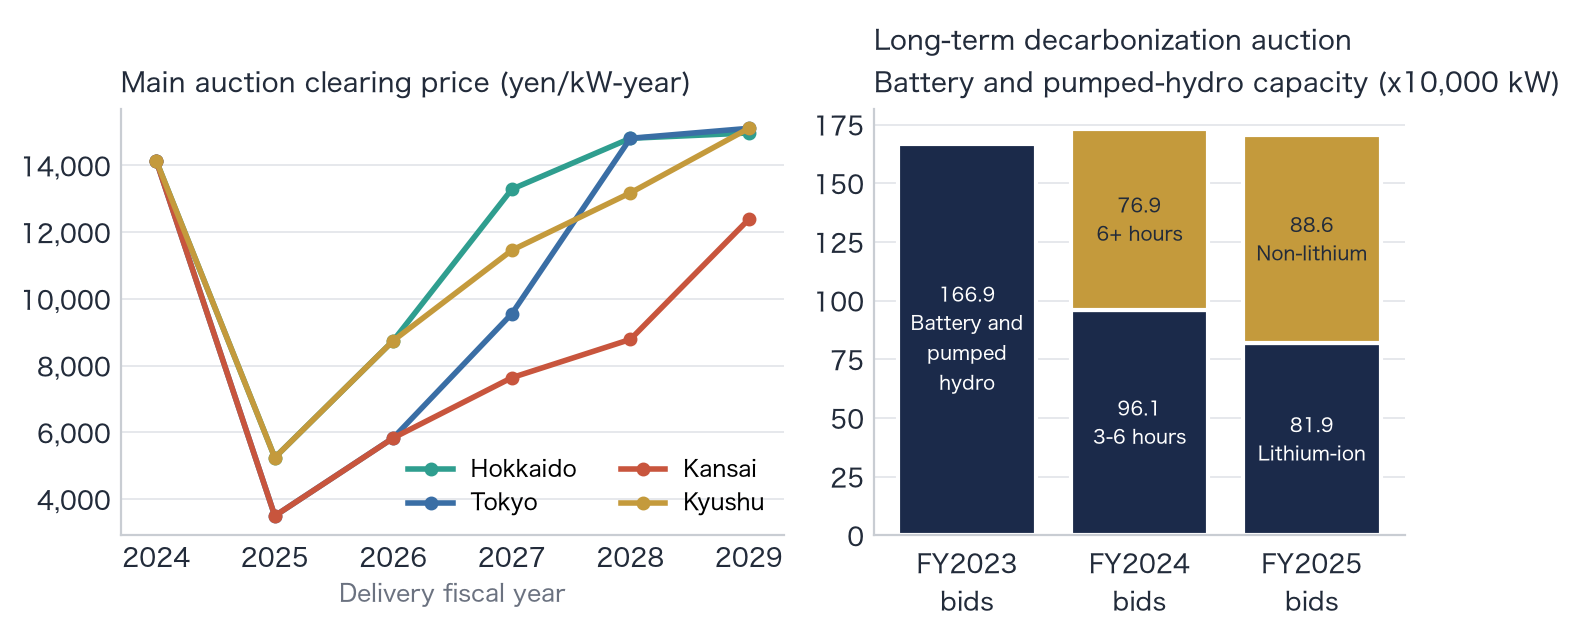
The capacity market buys electricity supply capacity 4 years ahead through an auction held once a year. The price is set in yen per kW per year. The left chart shows the clearing prices of past main auctions. The right chart shows the capacity of batteries and pumped hydro awarded in the Long-Term Decarbonization Power Source Auction (a separate auction that supports new builds such as batteries and pumped hydro). The results are published once a year, so they do not change every month. The latest is for delivery fiscal year FY2029 (published January 2026).

These are the latest yearly figures. In the capacity market, Tokyo cleared at 3,495 yen/kW for delivery fiscal year FY2025 and 15,111 yen/kW for FY2029. In the Long-Term Decarbonization Power Source Auction, batteries and pumped hydro awarded in the FY2025 round were 819 MW of lithium-ion and 886 MW of non-lithium.

Figure 7  Capacity market clearing prices (left, yen/kW) and capacity of batteries and pumped hydro awarded in the Long-Term Decarbonization Power Source Auction (right, in units of 10,000 kW)
Figure 7 Capacity market clearing prices (left, yen/kW) and capacity of batteries and pumped hydro awarded in the Long-Term Decarbonization Power Source Auction (right, in units of 10,000 kW)

Source: Clearing results and capacity contract documents published by the Organization for Cross-regional Coordination of Transmission Operators (OCCTO) (sources listed in section 11). Shown as published.

Where are battery projects increasing?

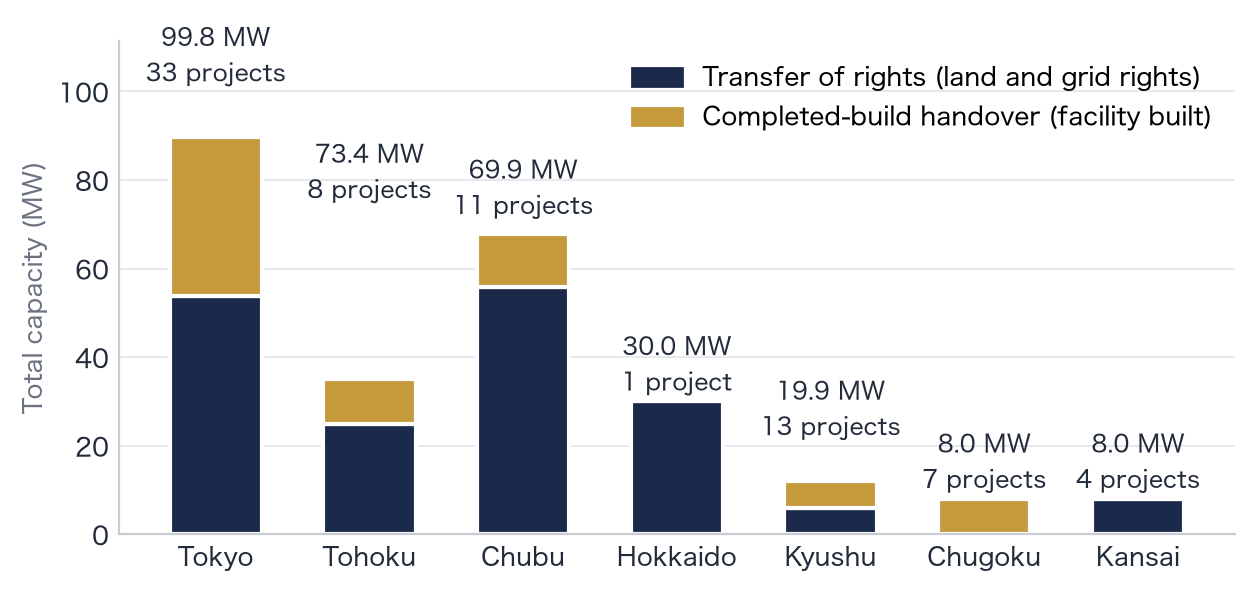
We counted the projects we newly listed this month on DealRoom (our data room for buyers, a site where we list battery site projects for buyers), by the grid area of each grid operator. These are the projects we handled, not the number for the whole market. Transfer of rights means selling the land and grid rights. Completed-build handover means handing over the site once the equipment is built.

In October, 77 new projects totaling 309.1 MW were listed. By grid area, Tokyo had 33 projects (99.8 MW), Tohoku 8 (73.4 MW) and Chubu 11 (69.9 MW).

Figure 8  Output (MW) of projects listed on our DealRoom in October 2026
Figure 8 Output (MW) of projects listed on our DealRoom in October 2026

Source: Our DealRoom records (project location shown only down to the grid area; prices and parties not listed).

How many months and how much does it take to connect to the grid?

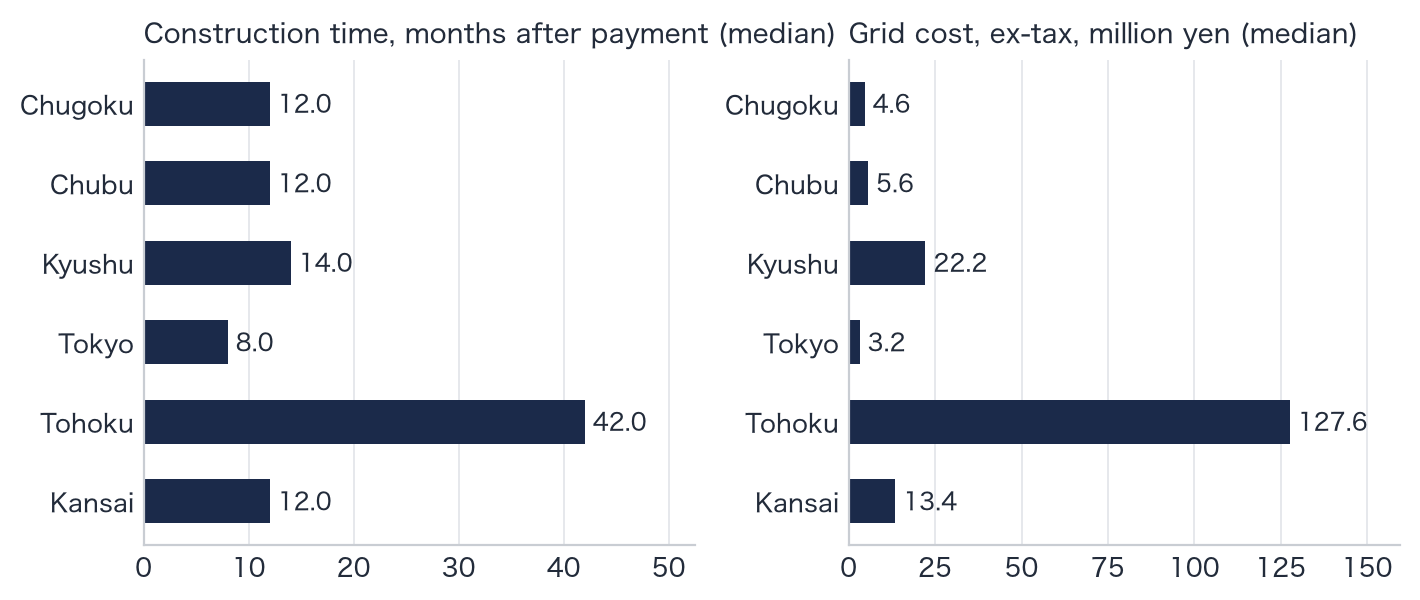
A grid connection study is the process of asking the grid operator to check "can we connect at this location, and how much will the work cost?" The grid connection cost contribution is the part of the connection work cost paid by the applicant. We compiled the study responses we have received, by grid area. Grid areas with fewer than 5 responses are not shown.

As of October 19, 2026, the medians were 8.0 months of construction and a grid connection cost contribution of ¥3.16 million in Tokyo, 14.0 months and ¥22.20 million in Kyushu, and 42.0 months and ¥127.60 million in Tohoku.

Figure 9  Median of grid connection study responses by grid area (left: months needed for the work, right: grid connection cost contribution, excluding tax)
Figure 9 Median of grid connection study responses by grid area (left: months needed for the work, right: grid connection cost contribution, excluding tax)

Source: Our compilation of grid connection study responses from grid operators that we have received (as of October 19, 2026).

Which prefectures do land inquiries come from?

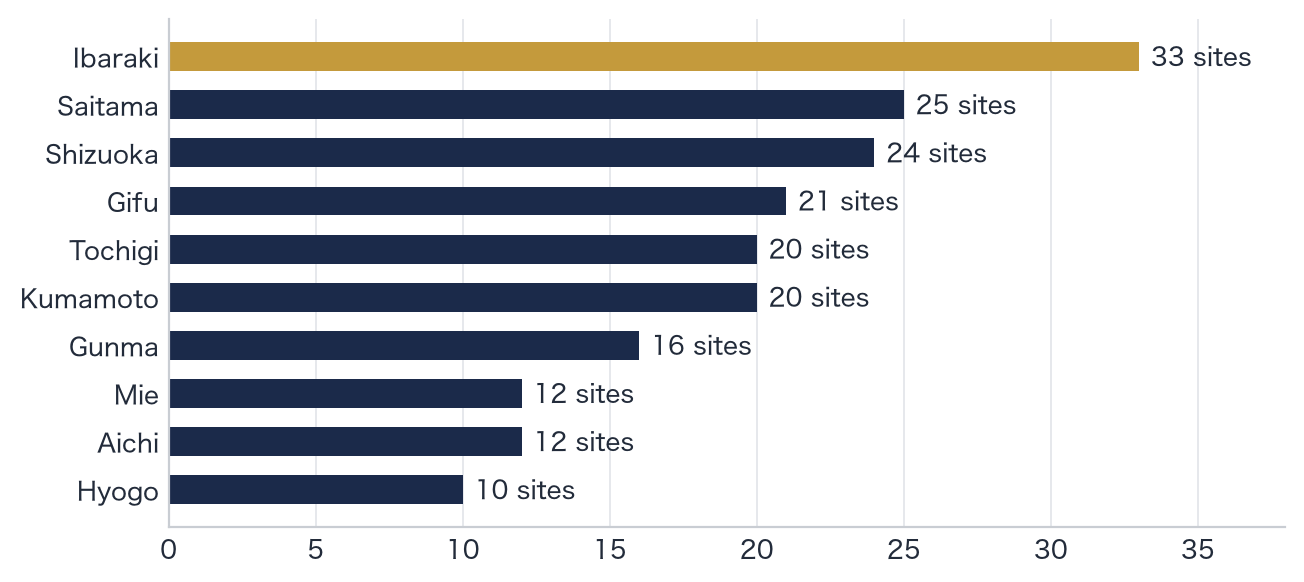
We counted the battery site land we know of (land listed on DealRoom and inquiries not listed there) by prefecture. We show counts only, not locations, prices or names.

Of the 339 sites we know of, by prefecture there are 33 in Ibaraki, 25 in Saitama, 24 in Shizuoka, 21 in Gifu and 20 in Tochigi.

Figure 10  Number of sites by prefecture (top 10 prefectures)
Figure 10 Number of sites by prefecture (top 10 prefectures)

Source: Our records.

Estimate assumptions and terms

Quoting and reuse
Charts and figures may be reused as they are, with the source stated (citation guide). The figures are tallies of published data and our own records, and the estimates are rough guides. They do not show or guarantee actual revenue. The assumptions are in section 11 above.

Each month's update also arrives in our LinkedIn newsletter, “Japan grid-scale BESS: primary data”. Subscribe to the newsletter →

Want the projects behind these numbers? Join DealRoom

Register on our data room, DealRoom (free), to request project-level documents such as grid connection answers. The list of projects can be viewed without registering.

Register on DealRoom → See projects for sale