A "grid-scale battery" (a large battery connected to the grid that stores electricity and releases it again) earns money by selling the "capacity" to fix surpluses and shortages of electricity, and from the price difference as electricity prices change through the day. These notes use published figures and our own records to show this month's trends in figures and tables. This issue is a back issue, prepared retroactively in November 2026. The grid connection study tally is as of the time it was prepared (October 19, 2026).
Science X Inc. · Published November 5, 2026 · A4, 14 pages
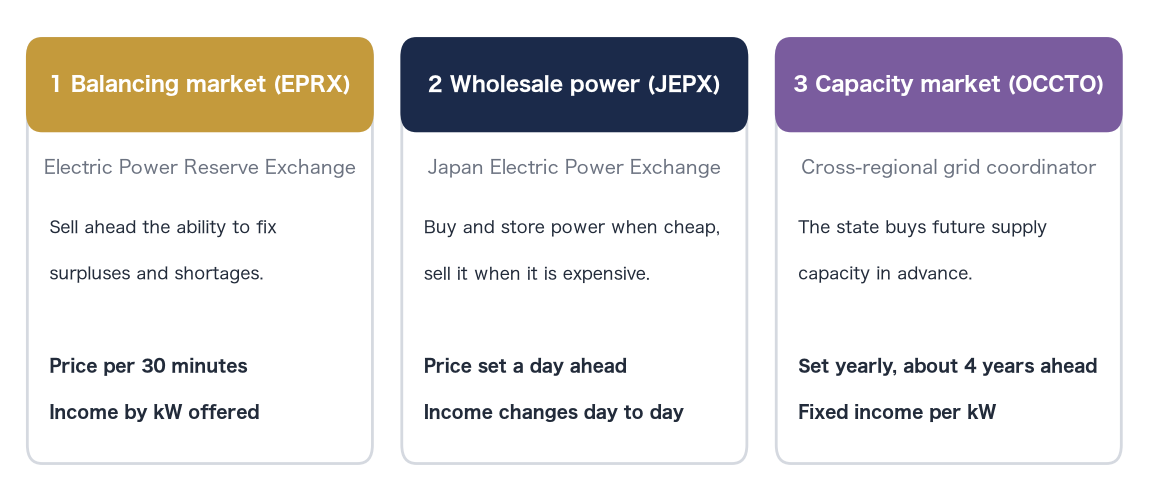
A battery storage plant (grid-scale battery) earns revenue from three markets. ① The balancing market (EPRX) is where you sell grid operators the "capacity" to fix surpluses and shortages of electricity. ② Wholesale electricity (JEPX) is the market where you buy electricity when it is cheap, store it, and sell it when it is expensive. ③ The capacity market (OCCTO) is where the country buys future electricity supply capacity in advance. These notes present the figures in the order of these three markets. The ①②③ at the start of each section title shows which market the section covers.

Source: Market rules of the Japan Electric Power Exchange (JEPX), the Electric Power Reserve Exchange (EPRX) and the Organization for Cross-regional Coordination of Transmission Operators (OCCTO).
From the figures for the three markets, we picked three trends for this month.
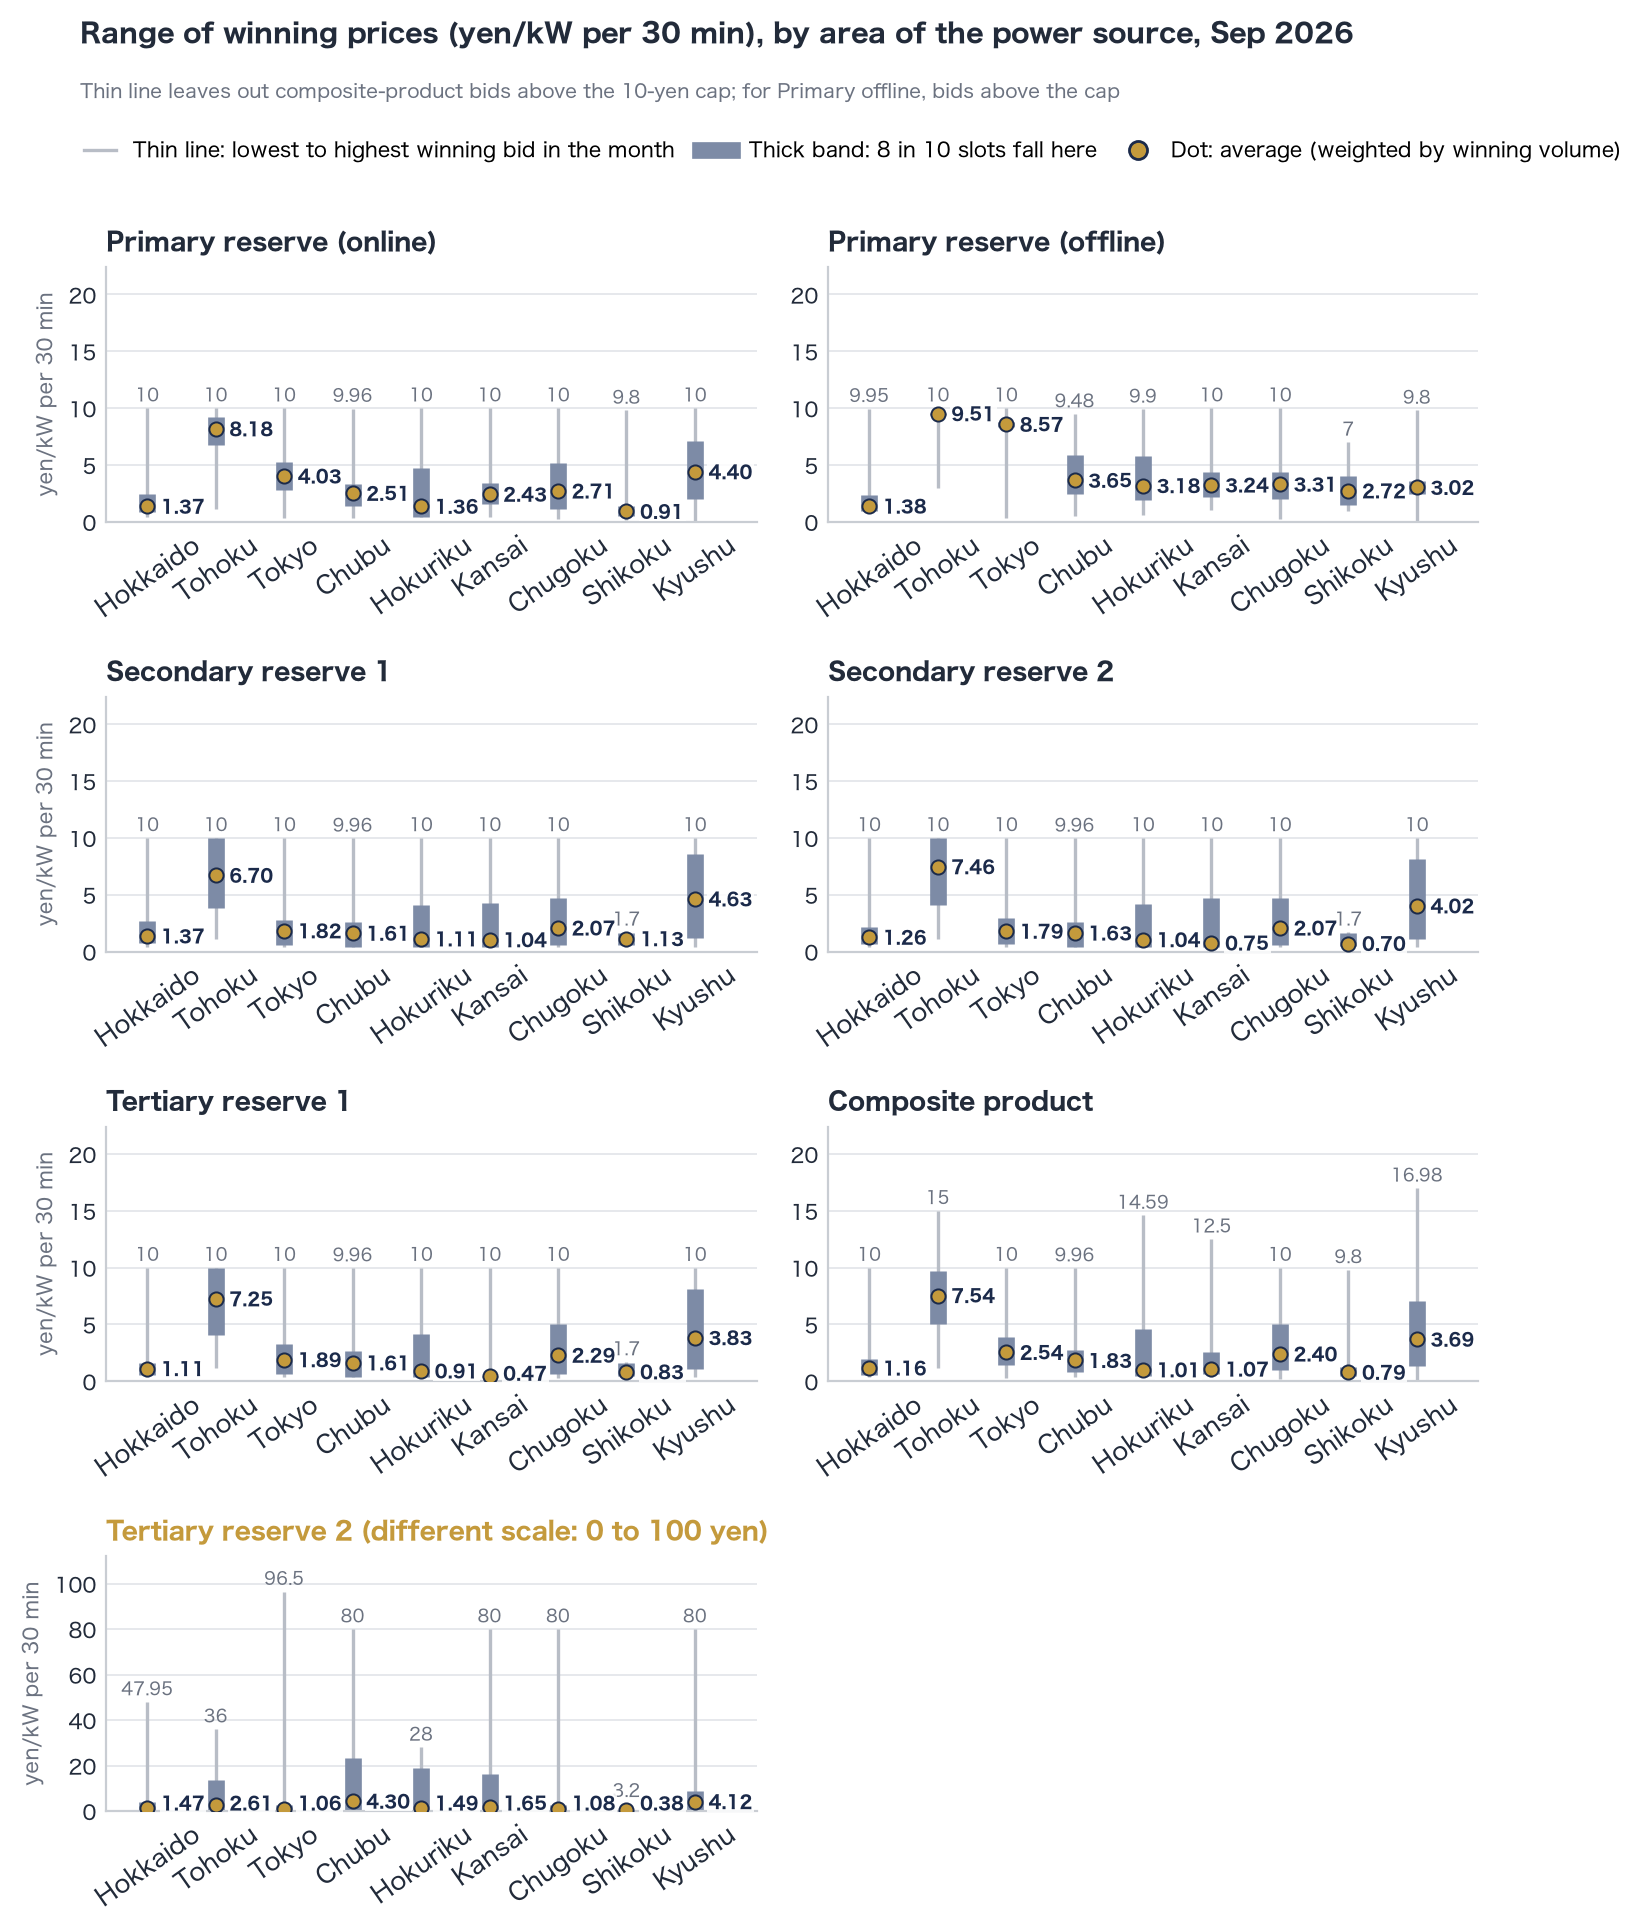
The balancing market is where grid operators buy, every 30 minutes, the "capacity" to fix surpluses and shortages of electricity. Products are split by how fast output must change after receiving an instruction. Primary reserve is the fastest and Tertiary reserve 2 is the slowest. Primary reserve has two categories, "online", connected to the grid operator by a dedicated line, and "offline", which runs on the simplified dispatch system without a dedicated line; they are procured and traded separately, so we show them separately. A Composite product is a bid that offers several products together. The price is set in yen per 1 kW of available capacity per 30 minutes. kW is a unit of power capacity, not to be confused with kWh, which measures the amount of electricity. One 30-minute trading unit is called a "slot". The figure shows the range of awarded prices by area (by area where the resource is located). The thin line runs from the month's cheapest to most expensive bid, the thick band is the price range covering 8 out of 10 of the 30-minute slots with awards, and the dot is the average awarded price. Nationwide figures are in the tables of the "Market figures" section.
Among the average awarded prices by area in the balancing market, the highest was Primary reserve (offline) in Tohoku at 9.51 yen/kW per 30 min, and the lowest was Tertiary reserve 2 in Shikoku at 0.38 yen/kW per 30 min.

Source: Trading results (preliminary) published by the Electric Power Reserve Exchange (EPRX). Our tally.
| Product | Time from instruction to output change | Duration |
|---|---|---|
| Primary reserve (online) | Within 10 seconds | 5 minutes or more |
| Primary reserve (offline) | Within 10 seconds | 5 minutes or more |
| Secondary reserve 1 | Within 5 minutes | 30 minutes |
| Secondary reserve 2 | Within 5 minutes | 30 minutes |
| Tertiary reserve 1 | Within 15 minutes | 30 minutes |
| Tertiary reserve 2 | Within 60 minutes | 30 minutes |
| Composite product | Requirements of the combined products | Requirements of the combined products |
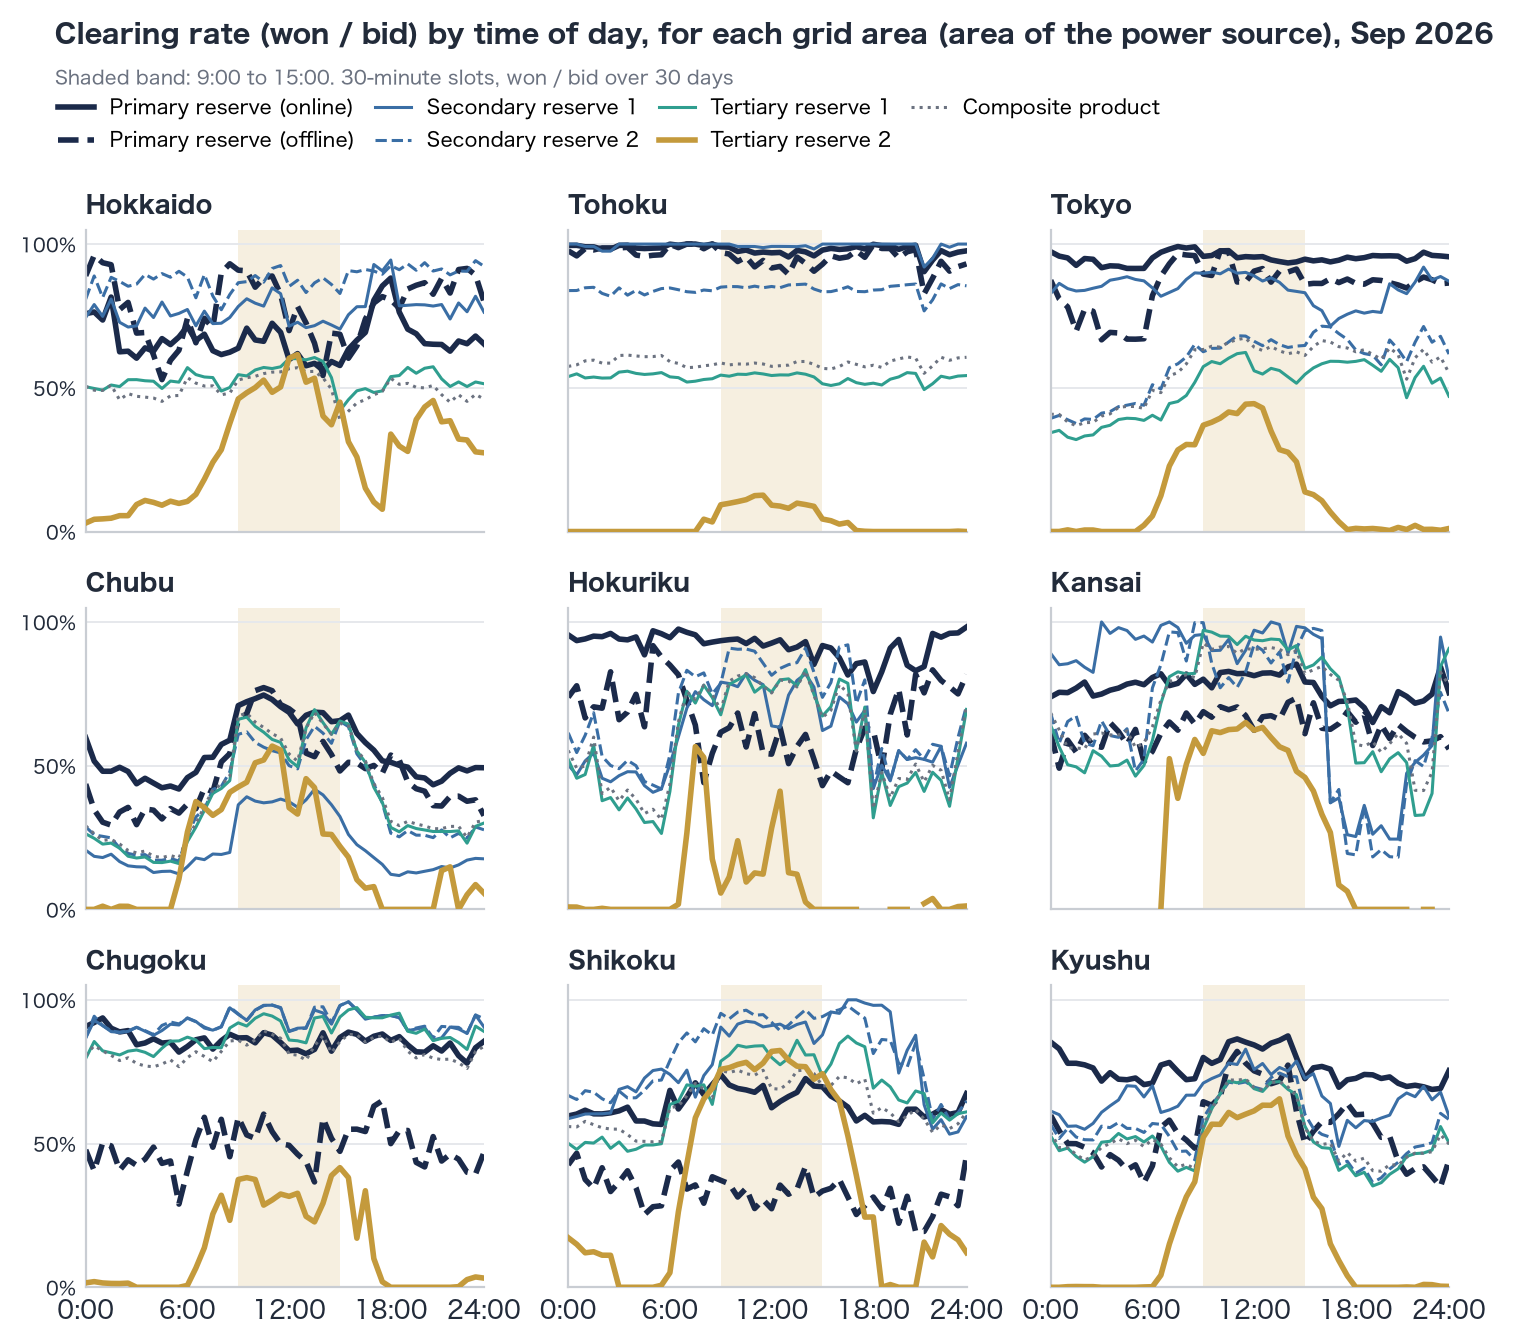
The award rate is the share of the bid volume that was awarded; the higher it is, the more easily bids win. The figure plots, for each grid area (area where the resource is located), the award rate of each product by time of day (every 30 minutes). Where a line breaks, there were no bids at that time.

Source: Trading results (preliminary) published by the Electric Power Reserve Exchange (EPRX). Our tally.
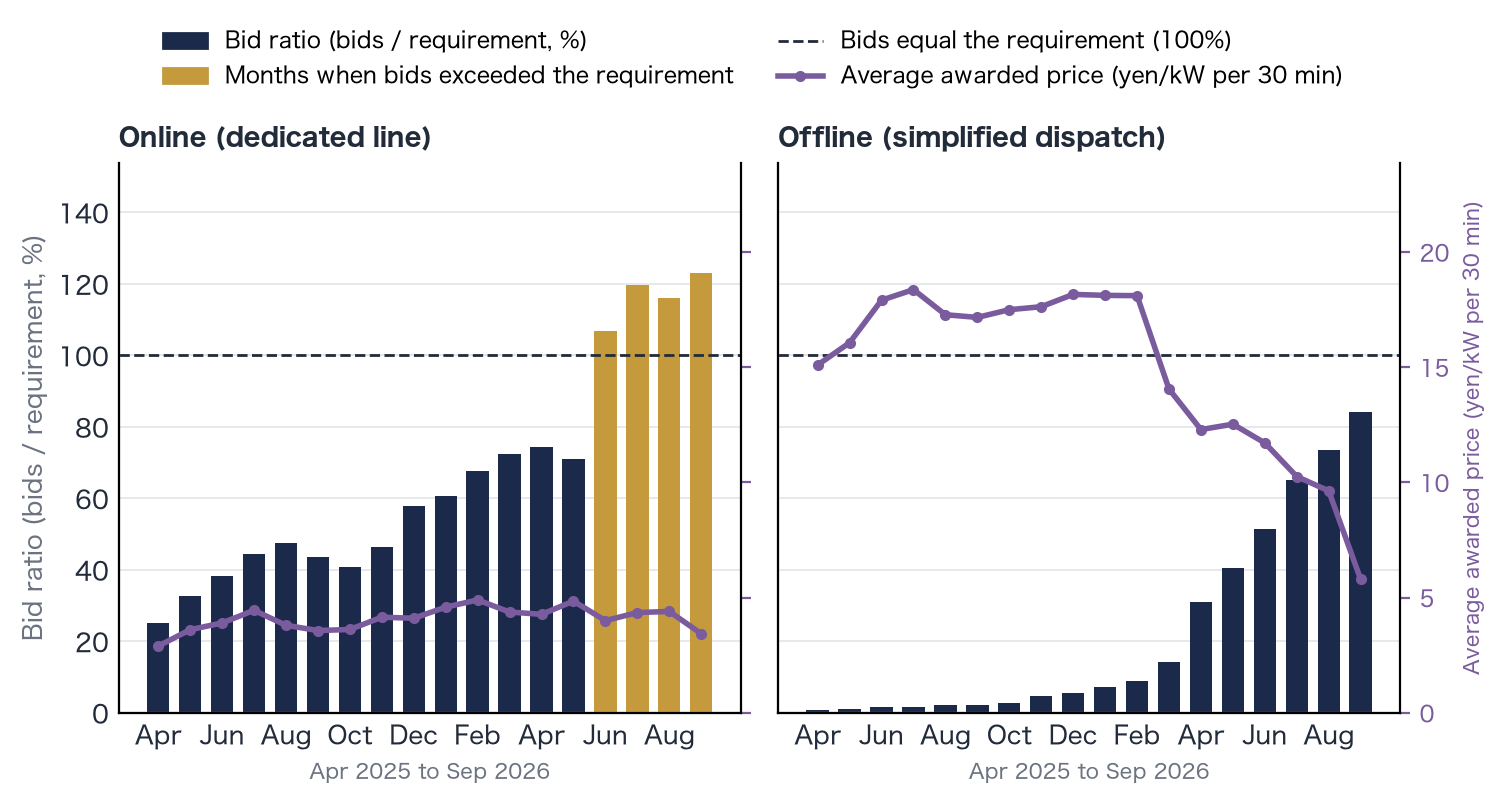
Primary reserve is the fastest product, changing output within 10 seconds of an instruction, and batteries are often used for it. The left side is the online category and the right side the offline category. The bars show the bid ratio (bid volume ÷ volume procured by grid operators); above 100%, more bids came in than were procured, and some bids lose. The bars rise either when bids increase or when the procured volume falls. The line is the average awarded price. These are the monthly figures we have, from April 2025.
The bid ratio for Primary reserve (online) in the balancing market rose above 100% to 106.8% in June 2026, and was 123.1% this month, with an average awarded price of 3.43 yen/kW per 30 min; the procured volume was 3,066.1 MW in April 2025 and 1,388.7 MW this month. For Primary reserve (offline), this month's bid ratio was 84.0% and the average awarded price 5.79 yen/kW per 30 min; the procured volume was 1,122.5 MW in April 2025 and 497.8 MW this month.

Source: Trading results (preliminary) published by the Electric Power Reserve Exchange (EPRX). Our tally.
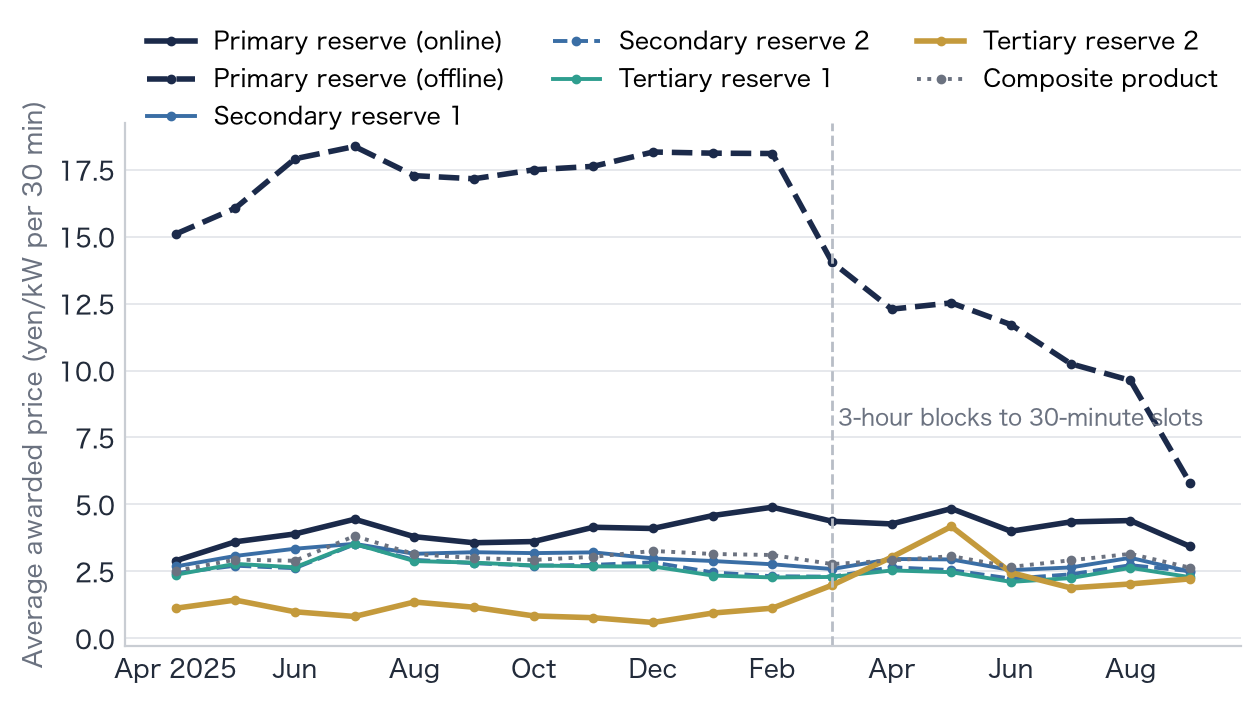
These are average awarded prices by product from April 2025 (monthly averages weighted by awarded volume). From March 14, 2026, Primary to Tertiary reserve 1 and the Composite product moved from 3-hour trading to 30-minute trading (Tertiary reserve 2 was already 30-minute).
Average awarded prices in the balancing market, April 2025 → this month, were 2.89 yen → 3.43 yen for Primary reserve (online) (peak 4.90 yen in February 2026), and 1.12 yen → 2.22 yen for Tertiary reserve 2 (peak 4.18 yen in May 2026).

Source: Trading results (preliminary) published by the Electric Power Reserve Exchange (EPRX). Our tally.
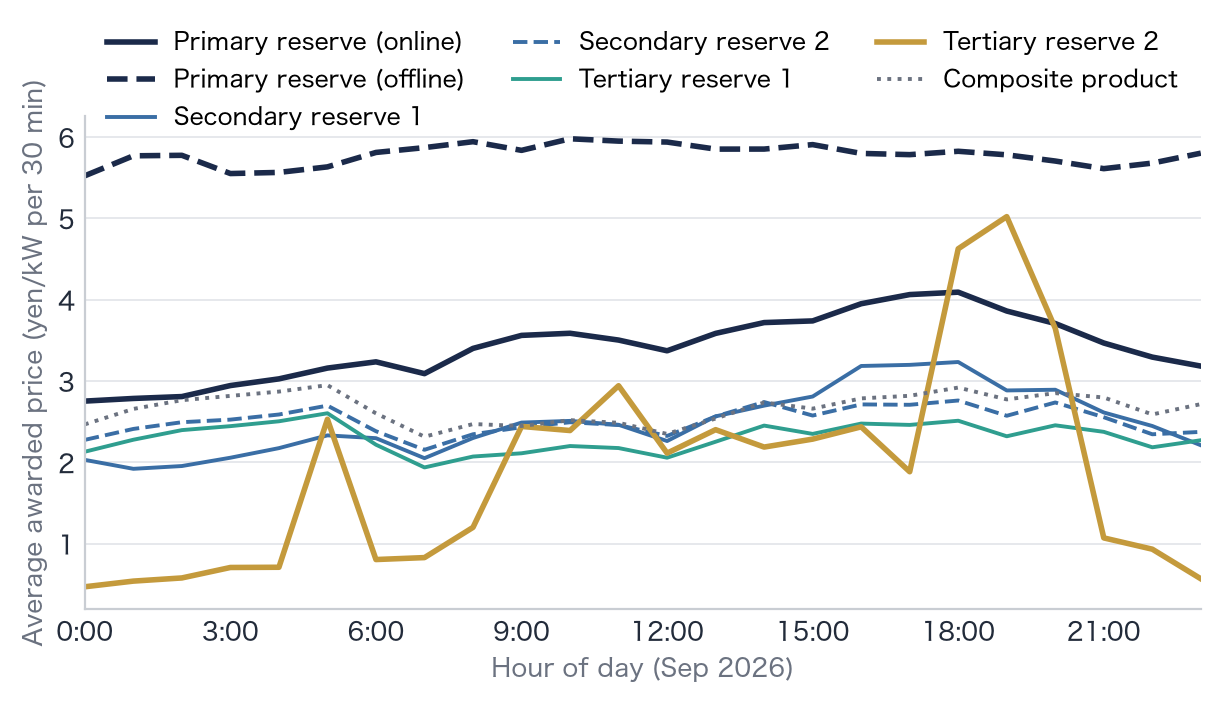
These are average awarded prices by product for each hour in September 2026 (1st–29th).
The most and least expensive hours for the average awarded price in the balancing market were 5.02 yen around 19:00 and 0.47 yen around 0:00 for Tertiary reserve 2, and 4.09 yen around 18:00 and 2.75 yen around 0:00 for Primary reserve (online).

Source: Trading results (preliminary) published by the Electric Power Reserve Exchange (EPRX). Our tally.
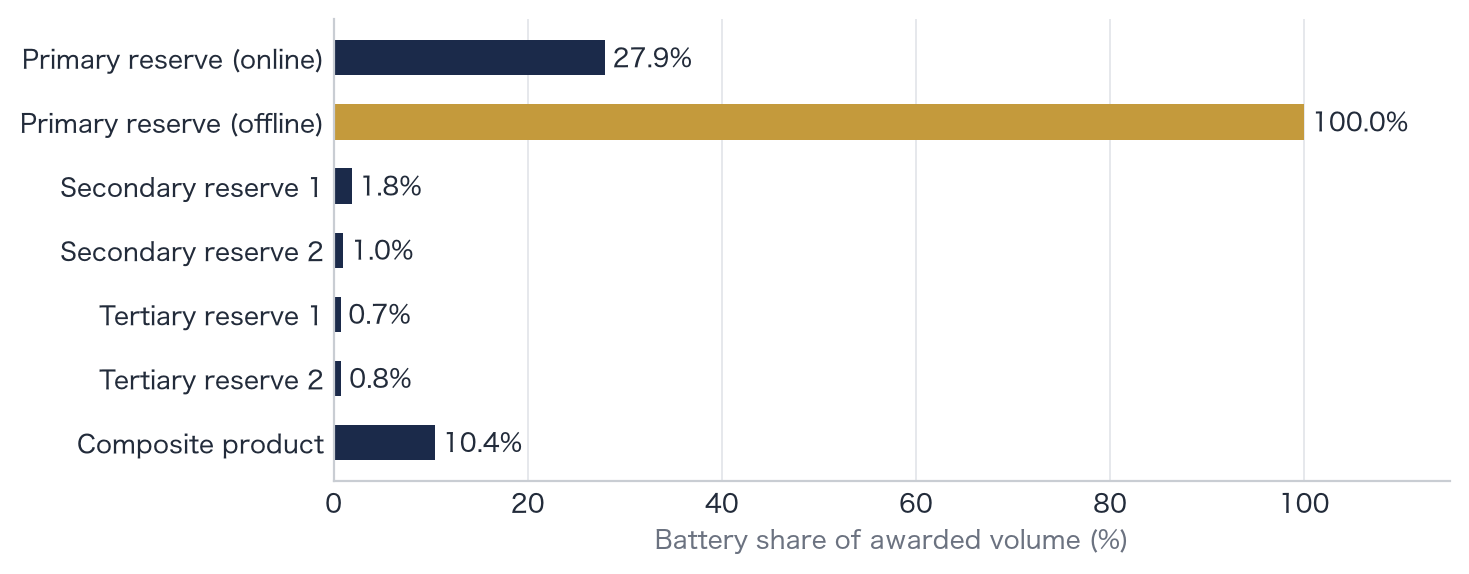
The figure shows the share of awarded volume taken by batteries. The table compares the average awarded price of the volume awarded to batteries with the average awarded price for the whole product.
For Primary reserve (online) in the balancing market, the battery share was 27.9%, and the average awarded price was 5.17 yen/kW per 30 min for the volume awarded to batteries, against 3.43 yen/kW per 30 min overall.

Source: Trading results (preliminary) by resource type published by the Electric Power Reserve Exchange (EPRX). Our tally.
| Product | Awarded to batteries (yen/kW per 30 min) | Whole product (yen/kW per 30 min) |
|---|---|---|
| Primary reserve (online) | 5.17 | 3.43 |
| Primary reserve (offline) | 5.79 | 5.79 |
| Secondary reserve 1 | 2.18 | 2.49 |
| Secondary reserve 2 | 1.85 | 2.51 |
| Tertiary reserve 1 | 1.86 | 2.28 |
| Tertiary reserve 2 | 59.26 | 2.22 |
| Composite product | 5.13 | 2.64 |
Both are averages weighted by awarded volume (September 2026, preliminary, nationwide). For Tertiary reserve 2, batteries account for only 0.8% of the awarded volume, and most of it was awarded in high-price slots, so their average comes out high.
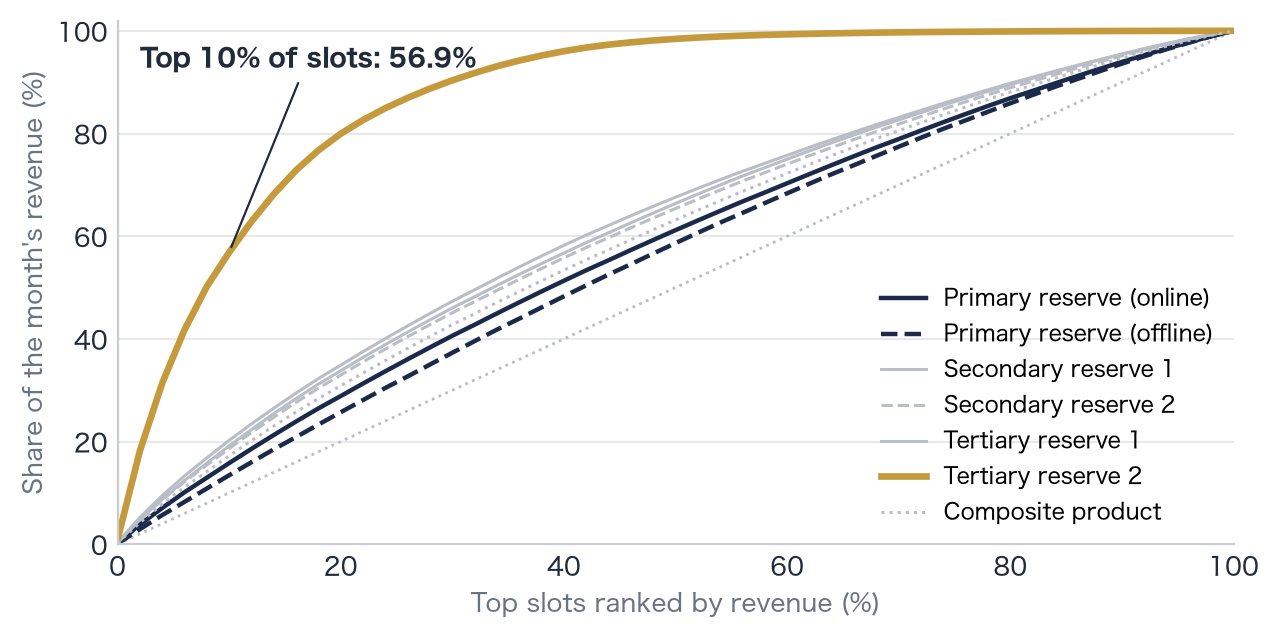
We ranked the month's 30-minute slots with awards by revenue (average awarded price × awarded volume, nationwide), from highest to lowest, and plotted for each product what share of the month's revenue the top slots account for. The further a curve bulges above the dotted line, the more revenue is concentrated in a few slots. Tertiary reserve 2 is a product that covers forecast errors in weather-dependent renewable generation; its price is low in most slots and high in a few.
In the balancing market, the top 10% of slots by revenue accounted for 56.9% of the month's revenue for Tertiary reserve 2 and 15.8% for Primary reserve (online); for the top 5%, the figures were 36.9% and 8.6%.

Source: Trading results (preliminary) published by the Electric Power Reserve Exchange (EPRX). Our tally.
In September 2026, out of 1,194 slots with awards, the top 1% of slots by revenue (average awarded price × awarded volume) accounted for 9.4% of the month's revenue. There were 25 slots with a nationwide average awarded price of 10 yen/kW per 30 min or more, and 198 slots with no awards.
Slots with the highest maximum awarded prices (by area where the resource is located):
| Date | Time | Area | Maximum awarded price (yen/kW per 30 min) |
|---|---|---|---|
| September 8 | 9:30 | Tokyo | 96.50 |
| September 8 | 10:30 | Tokyo | 96.50 |
| September 8 | 11:00 | Tokyo | 96.50 |
| September 27 | 11:00 | Tokyo | 96.00 |
| September 27 | 11:30 | Tokyo | 96.00 |
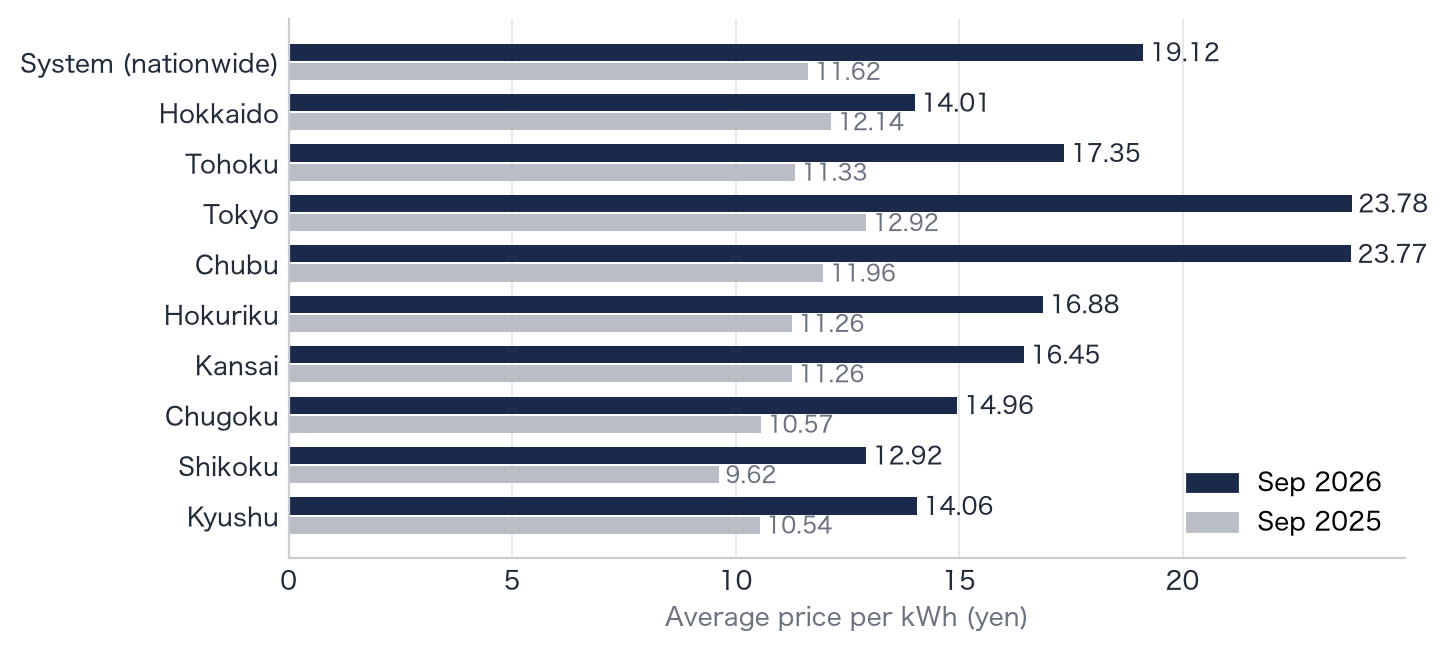
Wholesale electricity is electricity bought and sold between power companies and retailers. Its price is set on the "spot market" of the Japan Electric Power Exchange (JEPX) (a market where electricity for the next day is traded the day before). "System (nationwide)" is the price when all of Japan is treated as one market (the system price). When the transmission lines between regions are congested, prices split by area from Hokkaido to Kyushu (area prices).
The monthly average for wholesale electricity (JEPX) was 19.12 yen/kWh this month for the System (nationwide), against 11.62 yen/kWh in the same month last year, and 23.78 yen/kWh this month in Tokyo, against 12.92 yen/kWh in the same month last year.

Source: Spot market trading results published by the Japan Electric Power Exchange (JEPX). Simple average of 30-minute prices. Our tally.
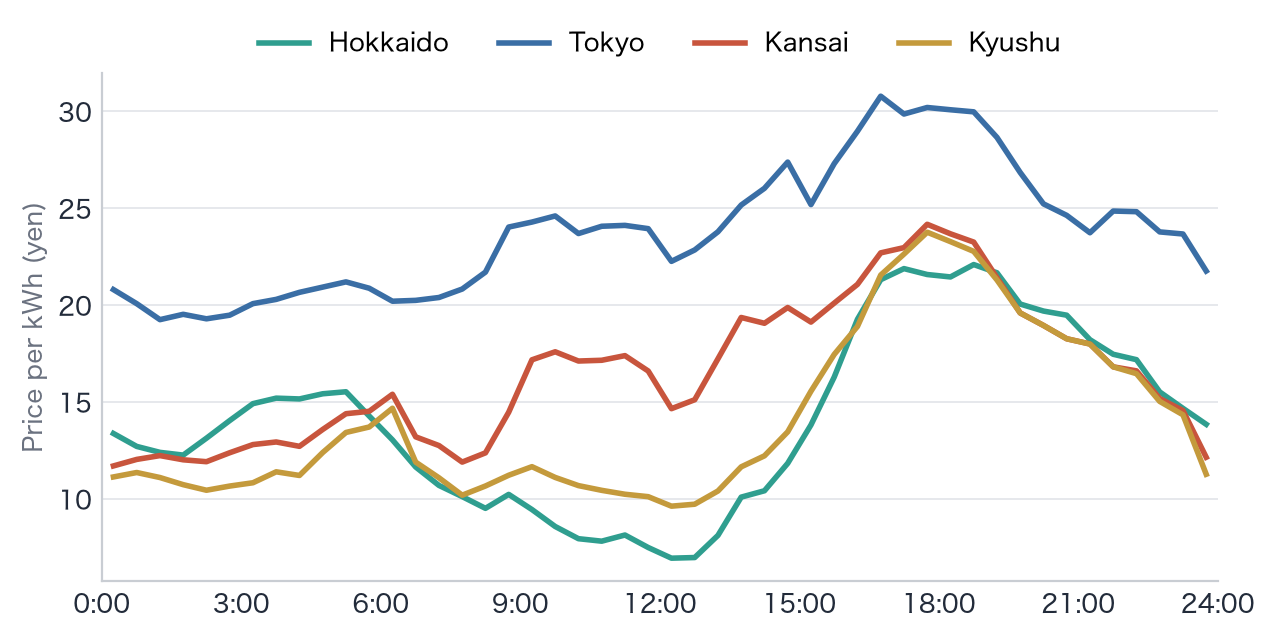
The wholesale electricity price changes every 30 minutes. The figure shows the daily shape, averaging the price at the same time of day across the month. If you store electricity when it is cheap and release it when it is expensive, the difference becomes the battery's revenue.
The trough and peak of the average wholesale electricity day were 19.23 yen around 1:00 and 30.77 yen around 16:30 in Tokyo, and 9.61 yen around 12:00 and 23.75 yen around 17:30 in Kyushu.

Source: JEPX spot market. Our tally.
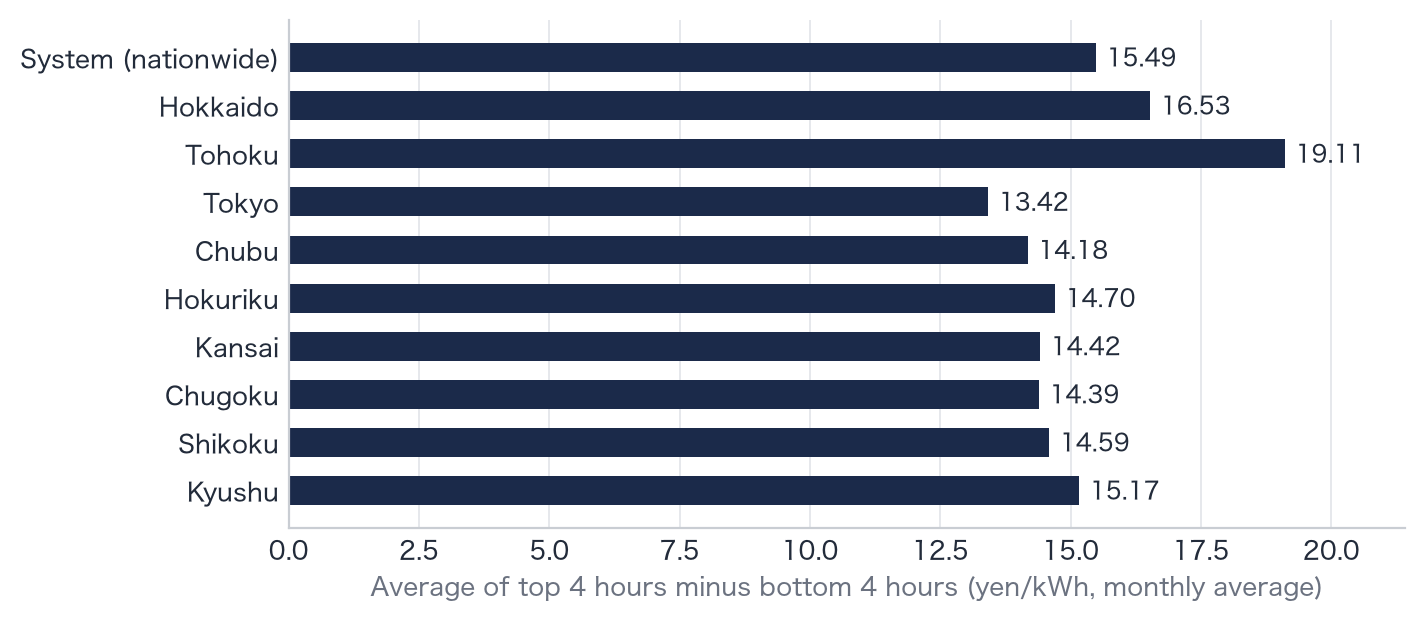
We took the average price of the day's 4 most expensive hours, subtracted the average price of its 4 cheapest hours, and show the monthly average of this difference by area. It equals the difference per kWh if you bought 1 kWh in the 4 cheapest hours and sold it in the 4 most expensive hours. It is a simple difference: it does not deduct electricity lost in charging and discharging or fees, and it ignores whether the cheap hours come before the expensive ones.
The monthly average spread between the 4 most expensive and 4 cheapest hours of wholesale electricity was largest in Tohoku at 19.11 yen/kWh and smallest in Tokyo at 13.42 yen/kWh.

Source: JEPX spot market. Our tally.
| Area | 2-hour spread (yen/kWh) | 4-hour spread (yen/kWh) | Days with a 4-hour spread of 10 yen or more |
|---|---|---|---|
| System (nationwide) | 17.16 | 15.49 | 28 |
| Hokkaido | 18.36 | 16.53 | 25 |
| Tohoku | 21.00 | 19.11 | 27 |
| Tokyo | 15.23 | 13.42 | 24 |
| Chubu | 15.99 | 14.18 | 25 |
| Hokuriku | 16.35 | 14.70 | 19 |
| Kansai | 16.22 | 14.42 | 19 |
| Chugoku | 16.31 | 14.39 | 20 |
| Shikoku | 16.87 | 14.59 | 22 |
| Kyushu | 16.87 | 15.17 | 19 |
The spread is the monthly average of the daily differences. September 2026 covers 30 days.
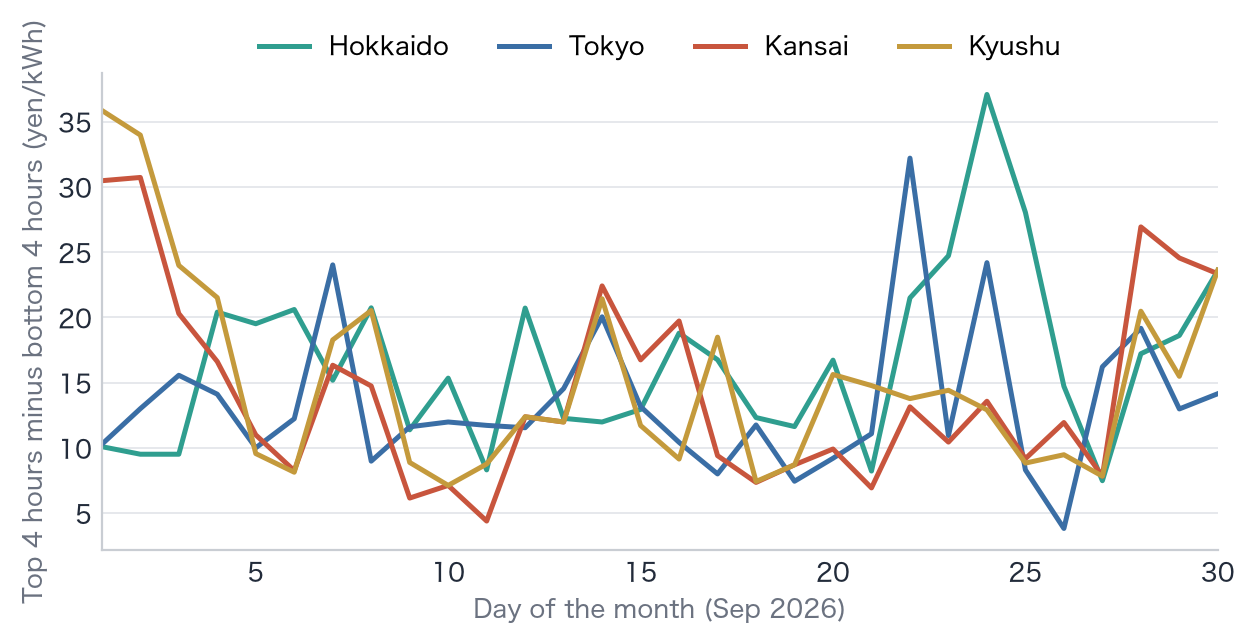
We show the same 4-hour spread day by day. The larger the spread on a given day, the more room a battery has to earn from it.
Out of 30 days, the 4-hour wholesale electricity spread was 10 yen or more on 28 days for the System (nationwide), 27 days in Tohoku, and 19 days each in Hokuriku, Kansai and Kyushu.

Source: JEPX spot market. Our tally.
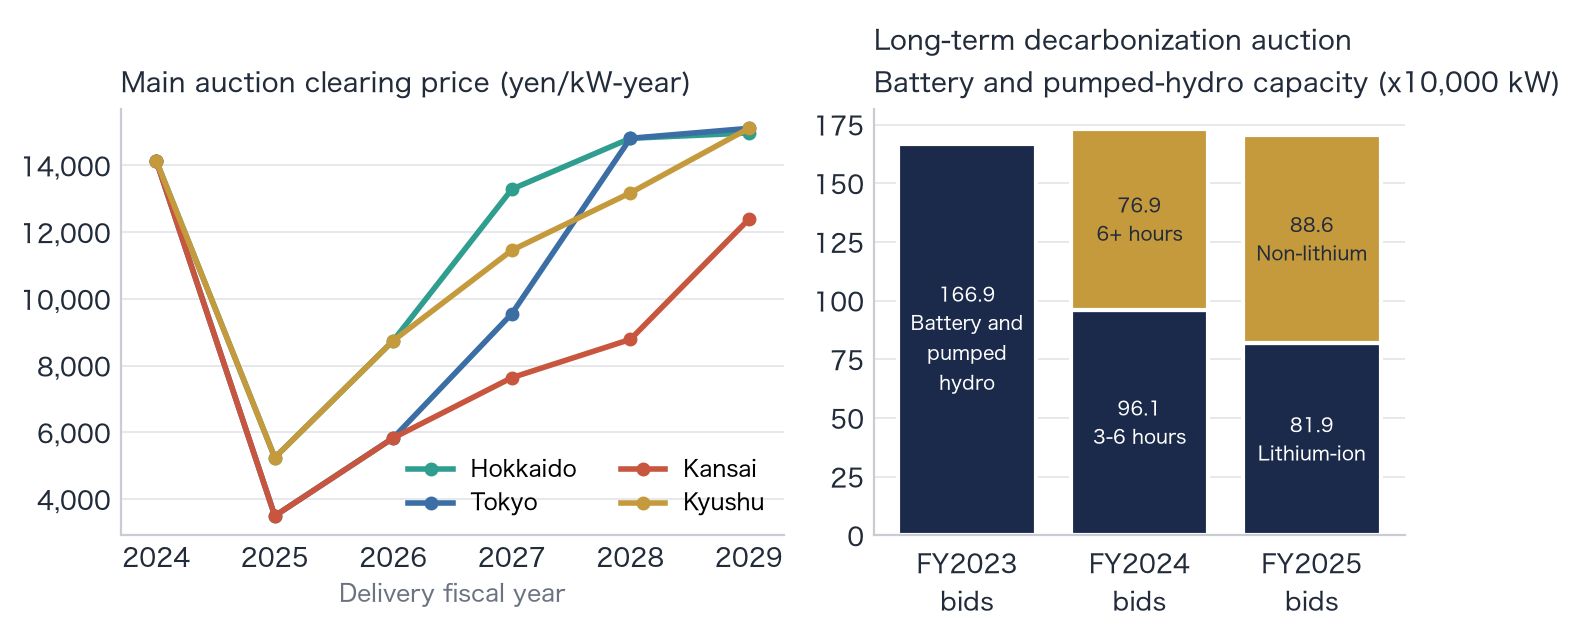
The capacity market buys electricity supply capacity 4 years ahead through an annual auction, with prices set in yen per kW per year. The left figure shows the clearing prices of past main auctions. The right figure shows the battery and pumped hydro capacity contracted in the Long-Term Decarbonization Power Source Auction (a separate auction that supports new builds such as batteries and pumped hydro). These are published once a year, so they do not change every month. The latest is delivery FY2029 (published January 2026).
The capacity market clearing price for Tokyo was 14,137 yen/kW for delivery FY2024, 3,495 yen/kW for FY2025 and 15,111 yen/kW for FY2029. In the Long-Term Decarbonization Power Source Auction, batteries and pumped hydro bid in FY2025 came to 819 MW of lithium-ion and 886 MW of non-lithium; both are annual values that do not change monthly, and are the latest published figures.

Source: Clearing results and capacity assurance contract documents published by the Organization for Cross-regional Coordination of Transmission Operators (OCCTO) (sources listed in the last section (Assumptions and terms)). As published.
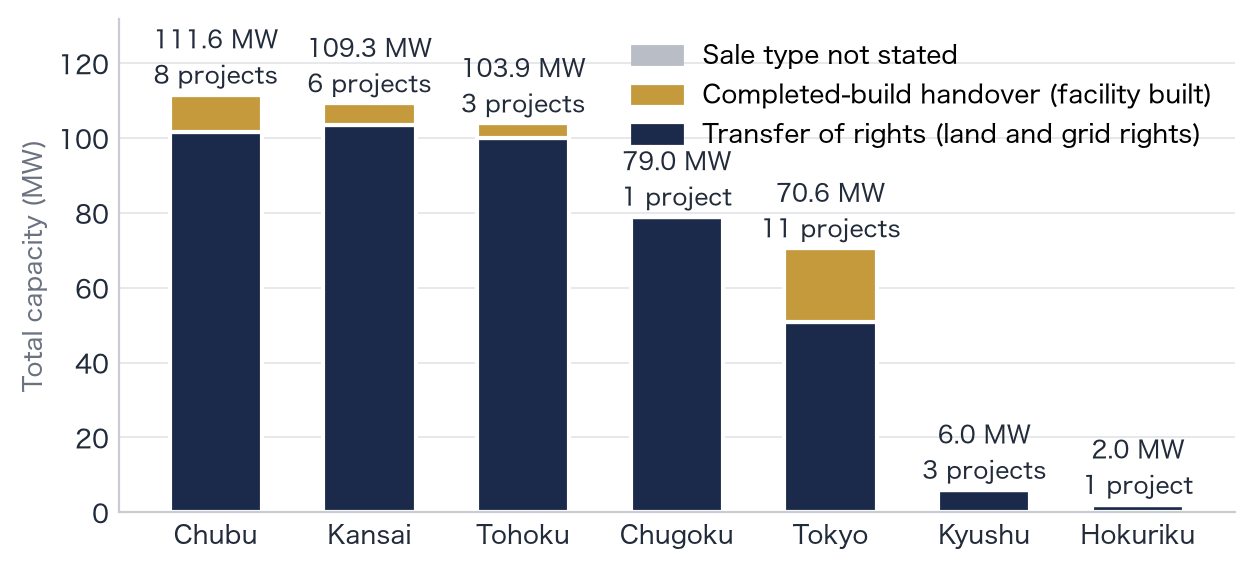
We counted the projects newly listed this month on DealRoom (our data room for buyers, a site where we list battery storage projects for buyers), by grid area of the grid operator. These are figures for projects we handled, not counts for the whole market. Transfer of rights is a sale that transfers the land and grid rights; Completed-build handover is a sale that hands over the plant once built.
New listings on DealRoom in September 2026 were 33 projects, 482.4 MW; by grid area, Chubu had 8 projects, 111.6 MW, Kansai 6 projects, 109.3 MW, and Tohoku 3 projects, 103.9 MW.

Source: Our DealRoom records (project locations are given only to the grid area; prices and parties are not listed).
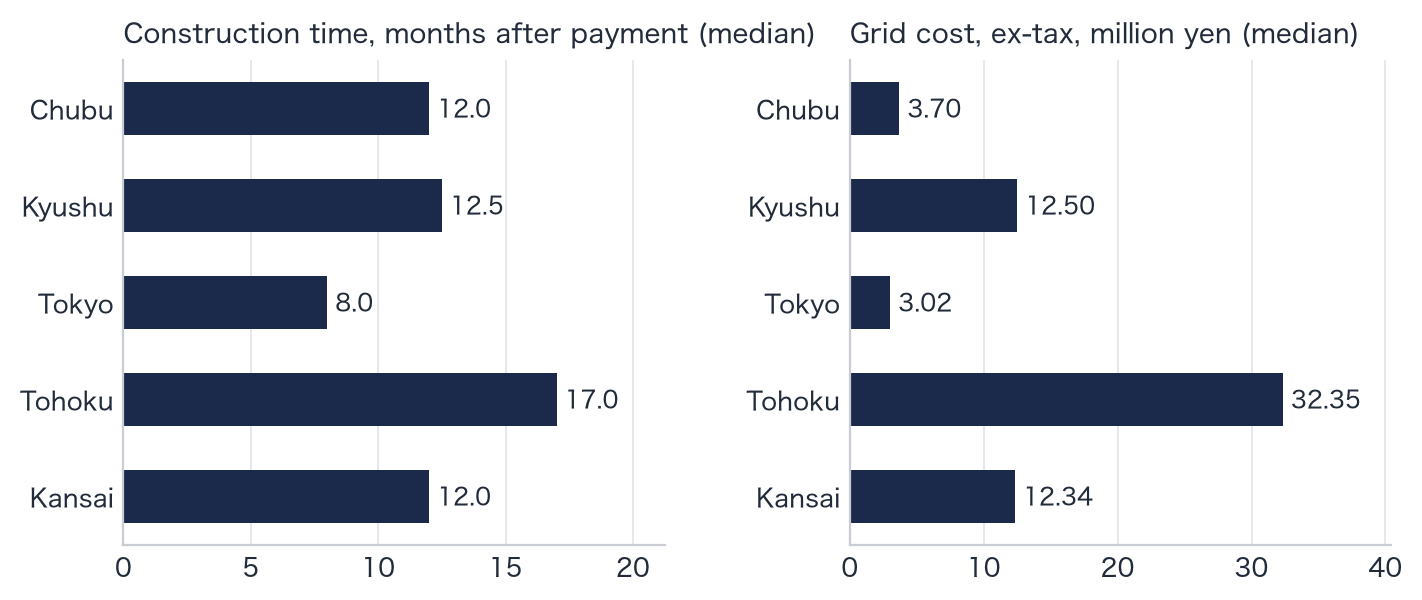
A grid connection study is the procedure where the grid operator checks "can this site connect, and how much will the work cost?" The grid connection cost contribution is the part of the connection work cost paid by the applicant. Of the replies we received, we tallied only high-voltage cases (connections to 6,600 V distribution lines), by grid area. Extra-high voltage is not included. Grid areas with fewer than 5 cases are not shown.
The medians in grid connection study replies (tally of high voltage only, as of October 19, 2026) range from 8.0 months in Tokyo to 17.0 months in Tohoku for construction time, and from ¥3.02 million in Tokyo to ¥32.35 million in Tohoku for the grid connection cost contribution.

Source: Tally of the high-voltage grid connection study replies we received from general transmission and distribution operators (as of October 19, 2026).
We put the figures behind the charts in tables so you can use them in your own materials: ① nationwide balancing market figures by product (bid ratio, award rate, price, battery share), ② wholesale electricity (JEPX) figures by area and trading volume, and ③ capacity market clearing prices.
Balancing market (September 2026, preliminary, nationwide)
| Product | Procured volume (MW) | Bid volume (MW) | Awarded volume (MW) | Bid ratio (bids ÷ procured) | Award rate (awarded ÷ bids) | Average awarded price (yen/kW per 30 min) | Battery share |
|---|---|---|---|---|---|---|---|
| Primary reserve (online) | 1,388.7 | 1,710.0 | 1,337.3 | 123.1% | 78.2% | 3.43 | 27.9% |
| Primary reserve (offline) | 497.8 | 418.4 | 265.7 | 84.0% | 63.5% | 5.79 | 100.0% |
| Secondary reserve 1 | 962.6 | 1,996.2 | 1,102.3 | 207.4% | 55.2% | 2.49 | 1.8% |
| Secondary reserve 2 | 983.1 | 3,709.3 | 2,163.2 | 377.3% | 58.3% | 2.51 | 1.0% |
| Tertiary reserve 1 | 2,498.5 | 5,895.9 | 3,021.0 | 236.0% | 51.2% | 2.28 | 0.7% |
| Tertiary reserve 2 | 376.3 | 1,371.7 | 368.9 | 364.5% | 26.9% | 2.22 | 0.8% |
| Composite product | 3,383.8 | 6,641.4 | 3,623.5 | 196.3% | 54.6% | 2.64 | 10.4% |
Volumes are averages per 30-minute slot. Products with a bid ratio under 100% did not receive enough bids for the procured volume. The award rate is the share of the bid volume that was awarded.
Wholesale electricity, JEPX spot market (September 2026, by area, yen/kWh)
| Area | Monthly average | Same month last year | Daytime (8–16h) | Evening (16–20h) | 4-hour spread | Maximum | Slots at 30 yen or more | Slots at 0.01 yen |
|---|---|---|---|---|---|---|---|---|
| System (nationwide) | 19.12 | 11.62 | 17.53 | 26.58 | 15.49 | 49.00 | 106 | 0 |
| Hokkaido | 14.01 | 12.14 | 9.59 | 21.15 | 16.53 | 50.01 | 30 | 56 |
| Tohoku | 17.35 | 11.33 | 11.48 | 26.21 | 19.11 | 50.01 | 90 | 16 |
| Tokyo | 23.78 | 12.92 | 24.38 | 29.40 | 13.42 | 50.01 | 265 | 0 |
| Chubu | 23.77 | 11.96 | 24.03 | 30.03 | 14.18 | 53.20 | 316 | 0 |
| Hokuriku | 16.88 | 11.26 | 18.30 | 22.55 | 14.70 | 53.20 | 164 | 0 |
| Kansai | 16.45 | 11.26 | 17.14 | 22.34 | 14.42 | 53.20 | 130 | 5 |
| Chugoku | 14.96 | 10.57 | 13.10 | 21.71 | 14.39 | 53.20 | 87 | 22 |
| Shikoku | 12.92 | 9.62 | 11.15 | 18.32 | 14.59 | 53.20 | 78 | 61 |
| Kyushu | 14.06 | 10.54 | 11.63 | 21.71 | 15.17 | 53.20 | 79 | 45 |
Trading volume (September 2026, total for 30 days): total contracted volume 32,413 million kWh (same month last year 24,757 million kWh), sell bid volume 51,279 million kWh, buy bid volume 40,562 million kWh.
Capacity market main auction area prices (yen/kW per year)
| Delivery fiscal year | Hokkaido | Tohoku | Tokyo | Chubu | Hokuriku | Kansai | Chugoku | Shikoku | Kyushu |
|---|---|---|---|---|---|---|---|---|---|
| FY2024 | 14,137 | 14,137 | 14,137 | 14,137 | 14,137 | 14,137 | 14,137 | 14,137 | 14,137 |
| FY2025 | 5,242 | 3,495 | 3,495 | 3,495 | 3,495 | 3,495 | 3,495 | 3,495 | 5,242 |
| FY2026 | 8,749 | 5,833 | 5,834 | 5,832 | 5,832 | 5,832 | 5,832 | 5,832 | 8,748 |
| FY2027 | 13,287 | 9,044 | 9,555 | 7,823 | 7,638 | 7,638 | 7,638 | 7,638 | 11,457 |
| FY2028 | 14,812 | 14,812 | 14,812 | 10,280 | 8,785 | 8,785 | 8,785 | 8,785 | 13,177 |
| FY2029 | 14,972 | 15,111 | 15,111 | 12,388 | 12,388 | 12,388 | 12,388 | 12,388 | 15,112 |
Battery and pumped hydro capacity contracted in the Long-Term Decarbonization Power Source Auction (10,000 kW)
| Bid year | Category | Contracted capacity (10,000 kW) |
|---|---|---|
| Bids in FY2023 | Batteries and pumped hydro | 166.9 |
| Bids in FY2024 | 3–6 hours | 96.1 |
| Bids in FY2024 | 6 hours or more | 76.9 |
| Bids in FY2025 | Lithium-ion | 81.9 |
| Bids in FY2025 | Non-lithium | 88.6 |
Each month's update also arrives in our LinkedIn newsletter, “Japan grid-scale BESS: primary data”. Subscribe to the newsletter →
Register on our data room, DealRoom (free), to request project-level documents such as grid connection answers. The list of projects can be viewed without registering.
Register on DealRoom → See projects for sale